Hungary records second-largest drop in number of businesses since 2018

Companies established and terminated
The number of companies established dropped 1.8% year on year to 2,174 in December. There was growth only in three months last year, in February (+15.1%), May (+10.4%), and October (+19.5%).
In the whole of 2024, the number of newly established companies reached 24,229, a yr/yr decline of 5.8% or nearly 1,500 businesses.

2,356 companies were terminated in December, 1.7% fewer than in the base period, while the 35,435 dissolutions in 2024 marks a 6.6% (or 2,489) yr/yr decline and has been the third highest figure since 2018.

Last year's dramatic developments can be seen in the graph below which shows that the monthly decline in the number of businesses was particularly crippling in the first half of the year, and also that 2024 did not start well in this respect.
The number of companies operating in Hungary dropped by just 182 in December (later revisions may change the figures slightly), which comes on the back of a more dramatic month (-1,411), although the first half of the year was clearly worse.

In 2024, the number of companies in operation declined by 11,206, the second worst annual figure since 2018.

After further dissolutions this year, there were 25,230 (-4.8%) fewer companies in operation in Hungary at the end of 2024 than in January 2018. Yet another new all-time low was hit in the first winter month of last year (-1.0% or 5,303 fewer companies in operation than the previous record low).

Liquidation starts and completions
In 2023, new liquidation proceedings reached their highest in six years. As we wrote in several articles last year, part of this was the result of the government's moratorium on company court proceedings during the coronavirus pandemic, so many procedures were not started until years later than a company had already failed. Although the total number of proceedings totalled 20,751 in 2023 (+145%), about half of that was a carry-over effect from the Covid crisis.
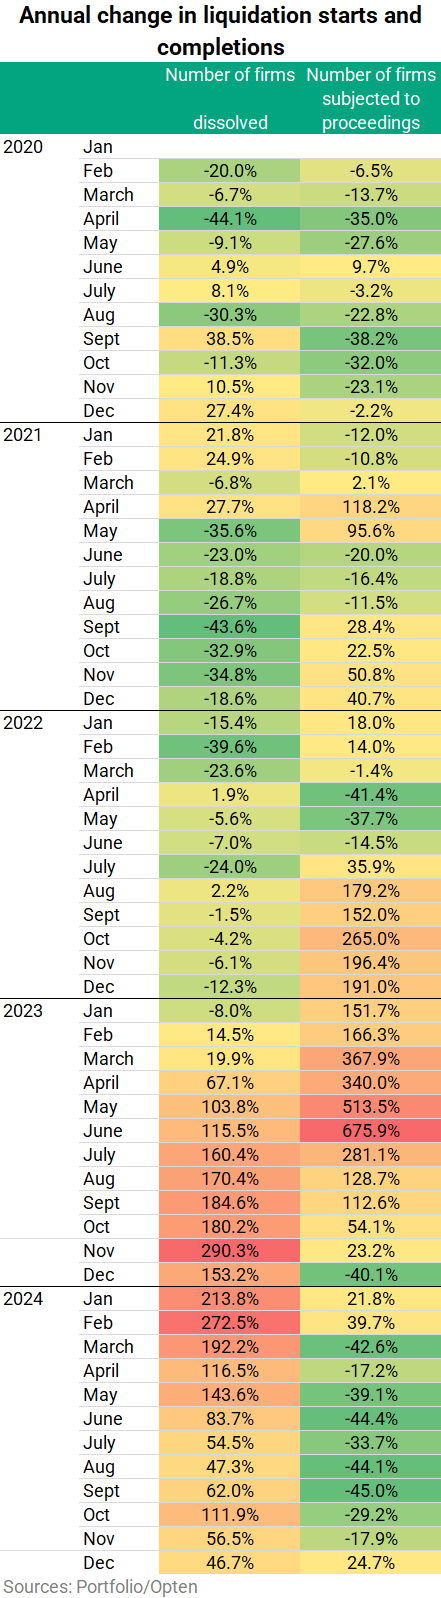
The 2024 tally shows 15,485 liquidation proceeding starts, a 25.3% improvement over the base period.

The number of liquidations completed reached 18.017, a staggering 98% year-on-year increase, i.e. almost double the 2023 figure (9,108), which was already the record for the period since 2018.

The number of liquidation starts in December (939) marks a 25% yr/yr increase from last December's 753 (after peaking at 2,514 in June, see heat map at the bottom). Between September and December 2023, 6,640 winding-up proceedings were opened. As the closure of proceedings can take several months, even years, the pickup in liquidation completions most likely had to do with this carry-over effect, particularly in the first five to six months. While liquidation starts rose in annual terms, they dropped 33% month on month in December rising for three consecutive months.
Liquidation completions reached 1,292 in December, up by a 47% yr/yr, which is still an improvement over the previous two readings (+56.5% and +112%). There was a 31% decline here in monthly terms.

Although the total number of liquidation proceedings started in 2023 totalled 20,751 (+145%), about half of that was a carry-over effect from the Covid crisis. As mentioned above, the number of liquidation proceedings starts just shy of 15,500 last year marks a 25.4% improvement over the base period (-5,266).
Sectoral breakdown
As for liquidation starts, the December figures were lower than in November across the board: Construction (-30.2%), Manufacturing (-35.8%), Trade and motor vehicle repair (-27%), and Tourism, hospitality (-27%), which is a welcome change after dramatic increases in September and some worsening in October and November too.
The number of liquidation starts dropped 33% month on month to 939 in all sectors in Dec, which follows three consecutive increases.
However, Opten recorded sharp annual increases in liquidation starts in all sectors (+25%), including Construction (-+33%) Manufacturing (+22%), Trade and motor vehicle repair (+24%) and Tourism, hospitality (+15%).
In 2024, the number of liquidation starts dropped 25.4% yr/yr to under 15,500, with a drop of 19.4% in Construction, 21.9% in Manufacturing, 28.6% in Retail and wholesale trade / repair of motor vehicles, and 30.2% in Tourism, hospitality.
As far as liquidation starts go, the yr/yr changes were negative across the board from March to November.


Manufacturing had four months last year (May, July, October, December) when more businesses pulled the plug than in the corresponding month in 2023, with the last figure showing a 10.6% growth.
After a sharp rise in the number of construction companies going out of business in October (+43%) and November (+29%), some relief followed in December, with 9.4% fewer companies throwing in the towel.
The construction industry had terminations over 500 each month this year except for July (470), August (328), and December (397).
We also see more completed liquidation procedures in hospitality/tourism Trade + vehicle repair (+4.3%), while fewer procedures were completed in Tourism / Hospitality (-1.7%) than in the same month of 2023.
The monthly changes were between -12% (Manufacturing) and -35.6% (Construction).
In 2024, liquidation proceedings were closed against nearly 6,200 construction firms, a 23% yr/yr increase, along with 2,176 in Manufacturing (-4.7%), 8,907 in Trade (+20.5%) and 1,621 in Tourism (+15.9%).


Cover image (for illustration purposes only): Getty Images