The ugly truth behind Hungary's glorified investment performance: there is nothing to celebrate


Hungarian investment is booming, money for investment is pouring into the country, the latest economic assessments boast. However, we should not pop the cork just yet, because these statements are based on a complete misunderstanding of reality.
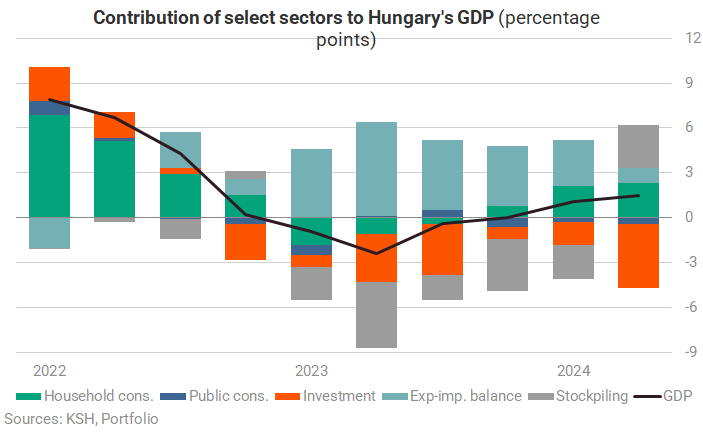
To refute the basic claim, a single graph is sufficient to show the free fall in investment. As can be seen, the volume of investment has been falling spectacularly and is now at a multi-year low.

However, setting this issue straight takes more than a single chart, because it has many more lessons to teach, including some that are particularly unpleasant.
What is investment?
In recent weeks, the development of investment in Hungary has been a topic of discussion several times, and I have been confronted with the fact that it is not entirely clear in everyday life what we mean by this. In economic terms, investment is the production or purchase of productive assets, but when we talk about it at the level of the national economy, the concept of "productive assets" becomes broader.
Investment includes the activities of all economic agents in the country. So not only the typically 'productive' investment of firms, but also the typically 'non-productive' investment of general government and households. For example, road or housing construction. Therefore, when we talk about the evolution of investment, we have to think of a very wide range of economic activity, 20-30% of annual GDP.
In other words, it is not only about corporate development projects, and especially not only about foreign direct investment (FDI) within it. A good example is that Hajdú-Bihar county (with the giant developments in Debrecen) is able to produce very high investment figures this year, while the national statistics show a very low level of investment.
So much so that, while public opinion is biased that insufficient household consumption is holding back the economy, the truth is that it is investment that is holding back GDP performance:
It is not only the nominal (in forint terms) value of investment or the volume growth (price-adjusted, volume change) of investment compared to a previous period that is worth examining here.
Equally interesting may be the investment relative to the size of the economy, the investment-to-GDP ratio. Now that the volume is falling, the communication has shifted to how the investment rate is still very high. And this is where Hungary's investment story begins, which, as we shall see, is not exactly a fairy tale.
Is the volume high or the costs?
Investment was the subject of a previous article, when there were signs of a turnaround in the very high investment-to-GDP ratio. A year has passed since, and it has become even more evident that investment is in big trouble.
The contradictory picture was illustrated in our previous article with a graph, indicating that high investment rates can be deceptive. Updating the graph makes the picture less confusing:

It can be clearly seen that the investment rates calculated in two different ways diverged in 2019, with one continuing to rise and the other declining. By the beginning of 2023, the divergence between the two indicators had reached its maximum.
The gap between them has not narrowed since then, but they are now painfully pointing in the same direction - downwards. In other words, one of our indicators rose until 2023 and, although it has fallen a lot since then, it is still not at a low level, while the other has been falling at an accelerating rate since the end of 2019.
The difference between the two is that while the green line shows the ratio of current price investment to current price GDP (which has risento 28% from 19% over 10 years), the fixed price rate, shown by the orange line, shows how the ratio of investment to GDP would have changed if prices had remained unchanged. A little more about this:
A bit of methodology
The investment rate measures how much we invest as a proportion of the value produced in the economy. This is done by dividing "fixed capital formation" (investment) by GDP. (Both indicators are highly seasonal, so we divide the totals of the last four quarters rather than the quarterly figures to smooth out large intra-year fluctuations.)
This calculation is the best possible expression of the current situation, with both elements of the rate being calculated at current (momentary market) prices, in forints. The indicator goes up or down depending on how investment and GDP at current prices change over time. If investment at current prices grows faster than GDP, the investment rate rises, and vice versa.
But this increase in current prices is not just about producing more or installing more machinery, it also includes inflation. Suppose that from one year to the next, the country produces the same amount of goods and services (GDP) and invests the same amount. The investment rate will remain unchanged only if, at the same time, the inflation rate on GDP (the GDP deflator) and the price change of capital goods (the investment price index) are the same. If, on the other hand, investment becomes more expensive, the investment rate rises even though there has been no real increase in output.
And this brings us to the explanation of the above graph. The green line showing an upward trend shows the investment rate at current prices, the orange line showing a downward trend shows the investment rate at constant (2015) prices. That is, the latter expresses how investment as a share of GDP would have changed in Hungary if prices had remained unchanged.
This makes the point we made a year ago even more valid:
the Hungarian investment rate is high not because there are a lot of development projects in the country, but because they are very expensive. In other words, even as brutally expensive investment accounted for an ever larger share of GDP, it was actually a smaller and smaller share of economic output.
Moreover, by now this rate is not so exceptional. We may be touting an index above 25%, but the fixed base index tells us that it still looks high because of the high cost, while in fact it is already below 22% after adjusting for price effects. And that 22% is no longer an outlier in the region.

The graph has to additional lessons.
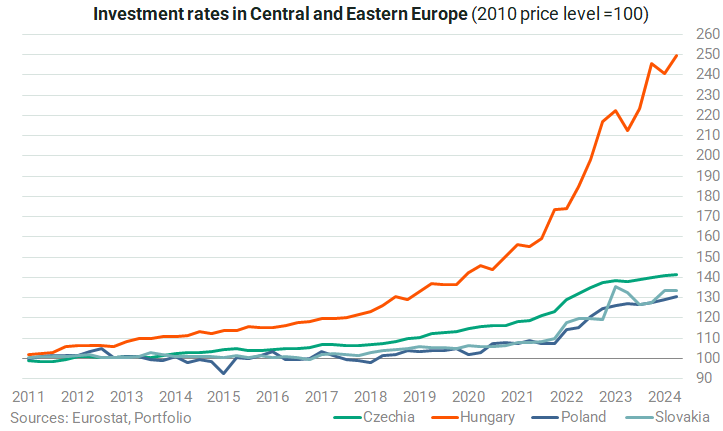
- One is that investment prices in other countries have not exploded as much as they have in Hungary (as evidenced by the fact that the orange and green lines have not behaved so differently anywhere else).

- The second is that the sharp fall in prices between 2019 and 2022 was not followed by a correction, as our two time series have not converged since then.
Both lessons are worth explaining a bit.
Since the other countries in the region in our review did not experience such a huge investment shock, it is suspected that internal reasons were at play in the domestic processes. In our previous article we identified one external and two internal causes. These are briefly:
The global economy's coordination issues, which took the form of supply problems, and the energy crisis have pushed up world commodity prices to unprecedented levels.
Internal over-stimulation has caused further scarcity on the Hungarian market. Large public projects tied up huge capacities, investment incentives provided additional stimuli, raw material producers worked with very long delivery times, and even then, in some places, they implemented absurd price increases.
The rise in input costs ran unhindered through public orders. The emblematic moment of this was the turn of 2021 and 2022 when, according to our estimates, the state likely accepted an average price hike of at least 40% on its total construction order book. In the private sector, there was no sign of such brutal repricing in the figures.
The graph below shows just how exceptional Hungary's investment price rises have been, they have risen by a factor of 2.5 since 2010, compared to an average increase of 35% in the other three countries.
Another observation is that the price level increase was not followed by a correction in the level of investment prices long after the shock in the price of construction raw materials had subsided.
When can we expect a turnaround?
In light of Hungary's disappointing economic growth, an important question is when investment will turn around. Fortunately, given the nature of the economic processes, the current slump is not expected to last for years, and investment will eventually stabilise, which in itself will improve the country's GDP performance. However, there are clearly limits to the recovery:
- Public investment is still in a postponement/cancellation phase and the fiscal situation is far from stable. This year's deficit target is in doubt, with next year's projections suggesting a higher probability of a deficit of 5% of GDP than the 3.7% target.
- While residential demand is picking up in the housing market, it is still rather concentrated in the second-hand segment. Few new building permits have been issued in recent quarters, so a rapid rebound is unlikely.
- Export firms have become very cautious due to feeble external demand, and recent data still do not show a recovery in the major economies.
- The SME sector, which supplies the domestic market, could increase its activity on the back of buoyant domestic consumption and falling interest rates. However, in recent years they have financed their development mainly through subsidised loans and EU funding. Compared to the current situation, we can expect some improvement in both areas, with the prospect of a new SME loan programme and a rise in the number of EU tenders. However, in neither case can we expect a huge boom. There are no public funds to support SME loans, and a significant part of EU funds is either blocked or already committed to previous projects.
The uncertainty is echoed in the central bank's (MNB) forecasts published last Thursday. The central bank's experts expect a contraction of 5.8-7.2% this year (after last year's 7.4% contraction), and a 1.5-4.5% investment expansion in 2025-2026.
Cover image (for illustration purposes only): Getty Images