Staggeringly weak Q3 GDP figure shows Hungary is in technical recession again


With the disappointing Q3 data, Hungary is back in a technical recession. The economy was last in a similar situation in the second half of 2022, during the energy crisis. In the nine quarters since then, GDP has only managed to grow in three quarters, and six quarters have seen a decline.
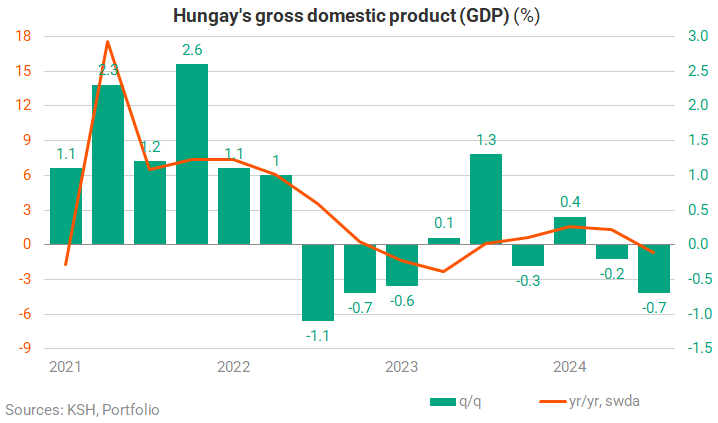
The persistent stalling of growth is illustrated well in the graph below, which shows the evolution of quarterly GDP levels. In fact, the economy has been stagnating and contracting slightly for more than two years.

Economy Minister Márton Nagy has already hinted at the weak growth data when he remarked at Portfolio's flagship economic conference, the Budapest Economic Forum, that annual GDP growth would be very close to zero in the third quarter. This suggested that the ministry expected an economic contraction compared to the previous quarter.
Partly as a result of this, market forecasts have also fallen sharply, but today's release is still a huge surprise on the downside.
Direct factors
The KSH does not release detailed figures in its flash estimate published just 30 days after the reporting period. Traditionally, the stats office refers to the structure of growth in a single sentence, and this is what they have written now:
- "The total performance of agriculture, industry and construction, making up about one-third of the economy, contributed to the decrease in the volume of gross domestic product compared to the same period of the previous year by approximately 2 percentage points.
- Both market and non-market service performances slowed the downturn."
This is in line with what we have learned so far, because we did have some suspicions. That economic activity was modest in July-September was evident in the monthly macro releases, although in many cases the September figures are still missing.
In the case of industry, for example, even with this uncertainty, it was not expected to do any better than stagnating production volumes compared with the previous quarter, with an annual decline of around 5%. On this basis, annual GDP growth could have been dampened by the industrial performance by up to 1 percentage point.

The limping construction sector has fallen sharply after a relatively strong second quarter, resulting in a 5-6% contraction in output on both an annual and quarterly basis. Due to the small weight of the sector (4%), it has less of a pull-back effect on GDP than industry, but it could also have reduced the annual and quarterly indices by a few tenths of a percentage point.

We cannot show you such a graph for the third productive sector, agriculture, but crops have been significantly worse this year than last year's good harvests, and this has also been a significant drag on GDP.
The three sectors together could have held back growth by as much as 1.5-2 percentage points on an annual basis, which should have been offset by the service sector. However, the services sector had been very subdued in the previous quarter, so there was a big question mark over how well it would do.
We have yet to see the details, and the monthly figures are a mixed picture. Retail sales showed modest growth in July-September compared to the previous quarter, while new car sales suffered. In tourism, the number of overnight stays in the period was slightly up on a year earlier.
Underlying factors
The Hungarian economy is facing more demand-side drag. Most often, we read about insufficient household consumption dynamics. In fact, however, in the first half of the year, household propensity to buy grew quite strongly at around 4%, the least problematic of the major growth drivers in the economy.
What is more painful is that Hungarian exports are stagnating because our European markets are weak, and the vehicle industry, which is so important to the country, is suffering from structural problems.
The second quarter investment data have dispelled any illusions about a quick turnaround, so we could not expect any acceleration from here either. The restraining factors can be roughly summarised as follows:
- weak external demand in Hungary's export markets
- slowly easing caution in private consumption
- the bursting of the investment bubble
- the need for fiscal adjustment
- the disrupted flow of EU funds
- high interest rates due to vulnerability
- adverse business sentiment due to the above.
So while the economy has overcome the socks of the coronavirus pandemic and soaring energy prices that hit since 2020, it is still unable to gather the momentum as expected.
What next?
The government has been expecting a sustained economic recovery since the second half of 2023, but it's already more than a year late. Our calculations including today's data suggest that an average annual average GDP growth of 1.5% this year is unachievable, and the only question is whether a 1% expansion will be achieved or not.
Economic policy now expects a recovery from the beginning of 2025. This will require improvements in the factors listed above. A halt in the fall in investment and a recovery in external markets could yield the most spectacular results, as manufacturing has the capacity to boost exports.
But for the government's expectations of growth over 3% to be realised, we need a real recovery, i.e. a quarter-on-quarter expansion of 1%, according to our estimates.
And this is the pace of a high-growth period of exceptionally favourable conditions before Covid.
Analysts at OTP Bank said the following a pre-release research note on Tuesday:
"The biggest problem related to growth is that the significant structural problems in Europe’s industrialized economies (high energy prices, automotive producers struggling with the adoption of new technologies and with intensifying competition, etc.) are unlikely to be resolved quickly.
"Moreover, the possible fiscal adjustments in France and Italy next year may further slow growth in Europe. A positive turn can only be expected from the loosening of the current restrictive economic policy and from the start of manufacture at new production capacities."
GDP growth in many forms - How we look at it
The KSH publishes several GDP indicators in its report. There are three (annual) indices compared to the same quarter of the previous year: raw, working-day adjusted and adjusted seasonally and for working days. Of these, the Portfolio has consistently considered the seasonally and working-day adjusted index (swda) as the headline index since 2016. This is because the number of working days (especially if there is a leap day in the reference or base period) has a significant impact on performance, which is definitely worth correcting for. In addition, seasonal adjustment for annual indicators only makes sense if the nature of seasonality within the year changes. Since Eurostat refers to the swda figure for all countries, it makes international comparisons easier if this is taken as the main figure.
The (quarter-on-quarter) GDP index relative to the previous quarter is, of course, always seasonally and working-day adjusted, as each quarter has a very different weight and structure within GDP, otherwise it makes no sense to expect growth. In most places in Europe, this is the main number and Portfolio tries to treat this number as a priority because of its favourable characteristics. However, this indicator has the unfortunate feature of end-point weakness, i.e. that due to the nature of seasonal adjustment, the numbers change several times afterwards, but it is still very useful as a short-base business cycle indicator.
Cover image (for illustration purposes only): Getty Images