Hungarian railways report improved punctuality in August

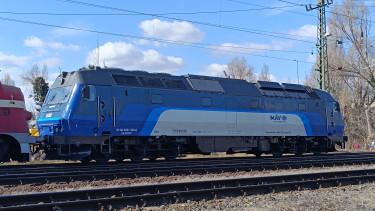
According to the company's data, 93,948 trains operated in August 2025, of which 79.01% (74,233 trains) arrived at their final destination either on time or with less than 6 minutes delay.
MÁV reported a 6.58% improvement compared to August 2024,
with both the number and average length of delays decreasing. Most delays were between 6-15 minutes, while delays exceeding 20 minutes - which qualify for a 50% ticket refund - occurred in less than 4% of trains, MTI reported on Tuesday.
In August, HUF 137.2 million were paid back to passengers under the delay insurance scheme, according to the announcement.
Punctuality also improved around Lake Balaton compared to last August, with approximately 9% improvement on the northern Balaton line and about 7% on the southern line.
The Miskolc, Hidasnémeti, Békéscsaba, and Szeged lines showed better performance, thanks to the continuous deployment of high-performance electric locomotives and temporary motor train operations introduced in summer.
The Budapest-Debrecen-Záhony railway line (Line 100) remained one of the poorest performers in August statistics. MÁV plans additional maintenance and renovation works on this line to improve punctuality.
The company highlighted that HÉV (suburban railway) operations faced significant challenges in August, serving mass passenger demands during the Hungarian Formula 1 Grand Prix, Sziget Festival, and August 20th events.
IC trains and their premium seats remained popular according to sales data. The number of cycling passengers remained exceptionally high in the last month of summer. The number of county and country passes sold increased compared to July, contrary to the usual decrease during school holidays.
While August typically shows the worst punctuality rates of the year, 2025 broke this pattern. This improvement was attributed to targeted track construction, locomotive acquisitions, and other fleet-strengthening measures, continuing the positive trend observed in June and July despite early summer storms.
The company noted that extreme heat continued to strain railway infrastructure and rolling stock, with national average temperatures in August 2025 exceeding the 1991-2020 average by 0.5 degrees. Additionally, nearly two dozen fatal accidents and several level crossing incidents disrupted scheduled services.
Last year, MÁV first reorganised its previously highly informative website on delays (menetrendszeruseg), starting to publish difficult-to-process (PDF) formats, then it simply wiped out all trace of that page. Our latest data was for October.

Various private individuals attempted to inform the public about delays, but this summer MÁV went so far as to force a hugely popular rail traffic information website to shut down. They replaced it with a useless map format on their own website.
Tamás Ferenci, a biostatistician, has ventured slightly outside his field of expertise and used his interest for the railway and his extensive knowledge of statistics to create his own website, which offers a wealth of railway data, including information on delays.
"Although the MÁV website publicly displays the scheduled and actual arrival times of every train at every stop, including any delays, there are no continuously updated statistics that can be displayed on a graph or map and interactively queried," Ferenci writes on his website.
Every night, the programme behind the website downloads the scheduled and actual arrival times from the MÁV website. It then calculates the delays and compiles a wide variety of statistics, which are made available via an interactive query interface.
We have looked at some of the data on the website and generated a few graphs for your viewing pleasure.
In August, 20.2% of the trains were late by more than 5 minutes and 2.2% of them were late by more than 20 minutes. The former shows worsening compared to July and June, while the latter shows an improvement over the July print but no change compared to June. The curret figures are for up to 15 September.

Ferenci offers a more detailed breakdown of the delays, which we present here for August and up to mid-September.


A monthly breakdown of the same data set can be seen in the graph below, showing that, on average,
- around 53% of trains are late by 1-5 minutes;
- about 11.5% of them 6-10 minutes late;
- about 3.6% run 11-15 minutes late;
- about 1.4% run 16-20 minutes late; and
- some 1.3% are late by 21-30 minutes.

The two main categories, if you can pick such, are delays by more than 5 minutes and trains being late by more than 20 minutes. The charts below show these figures, first for the period between 1 June and 15 September then in a monthly breakdown.


Cover photo: Portfolio