COVID-19: Same number of people in critical condition, with one third of patients in hospital as a year ago


SNAPSHOT --- 2 November 2021 vs. 2 November 2020:
- new cases--- 2,595 vs. 3,989 (-35%)
- active cases--- 46,408 vs. 63,940 (-27%)
- in hospital--- 3,172 vs. 4,767 (-33%)
- on ventilator--- 350 vs. 348 (+0.6%)
- test positivity rate --- 20.2% vs. 22.7%
- 3-day average percent positive--- 17.63% vs. 20.32%
- accumulated cases (1 Aug – 2 Nov) --- 69,485 vs. 82,243 (-15.5%)
- accumulated deaths (1 Aug – 2 Nov) --- 967 vs. 1,375 (-30%)
Last Thursday, the government finally came to its senses and decided to tighten restrictions to some extent. As of 1 November (why they had to wait three days to implement these measures is a mystery), mask-wearing is compulsory in public transport, visiting in health care institutions is banned, and companies are now allowed to require their employees to be vaccinated against coronavirus. State institutions are no exception.
Comparison of daily and monthly accumulated data (new cases, fatalities) for the 1 August – 2 November period.

The number of Covid patients admitted to hospitals and needing mechanical ventilation has been on the rise for a while now, and their are already at mid-May levels.

On charts below the 0% line is important. When the curves are under 0% there’s a decline, when they go over 0% it’s an increase. The changes show that the situation in terms of hospitalisations started to worsen after 20 August.
More importantly, when a value is north of 0% but the curve descends, it means an increase at a slowing rate, rather than a decrease. If the curve is above 0% and ascending, it is an increase at an accelerating rate. When we are under 0% and the curve goes lower, it translates into an accelerating decrease, and when it goes up it marks a decelerating decrease.

When the Case Fatality Rate (CFR, shown on a reversed scale below) drops the pandemic starts to gather momentum, because CFR = deaths / registered cases. There is an increasing number of new confirmed COVID-19 cases but the number of Covid fatalities is just starting to catch up. Whatever looks like a drop on the chart, is actually an increase in reality. On this chart the CFR is shown in parallel with the number of new daily confirmed cases, as well as their 3-day and 7-day averages.
CFR is the number of Covid fatalities divided by the number of confirmed cases. If you perform very few tests as Hungary does, you'll have massive underdetection. The number of deaths rise but the number of confirmed cases remains relatively low, hence the high CFR.

As regards the left-hand chart below, the number of new COVID-19 cases accumulated since 28 August is only 17% lower than in the same period of 2020, while it was 38% lower only two weeks ago and nearly 50% lower four weeks ago. In the meantime, the accumulated time Covid patients spend in hospital is 35% shorter than a year ago, while it was 13% lower four weeks ago and 25% higher eight weeks ago. (The turnaround came about on 22 September, about a month after the no-restrictions four-day celebrations of the foundation of the state on 20 August.)
On the right-hand chart see that only six weeks ago (mid-Sept) the number of accumulated days spent in ICUs (practically on ventilator) was double of the base period's print, while the difference has narrowed to 2.2% by now despite the lower number of cases (accumulated) and fewer days (accumulated) coronavirus patients spend in hospital. This means that there should be a lot more cases to match the severity of this wave as demonstrated by the number of days spent on ventilator.

In terms of the accumulated number of Covid-related fatalities we are not where we were a year ago (accumulation is 31% lower vs. 66% higher 8 weeks ago), but at that time there were no vaccines and cross-immunity (if it works at all) was assumably not as strong as currently. The right-hand chart also depicts that those that admitted to hospital with coronavirus infection are generally in worse condition than Covid patients a year ago.

The number of Covid patients hospitalised is about 40% of the corresponding figure on the same day in 2020, while the number of those in ICUs practically match the base period’s data. On the right-hand chart below the shape drawn by the red and green curves is incidentally similar to the outline of Hungary, with an ‘Eastern Opening’ happening right in front of our eyes.


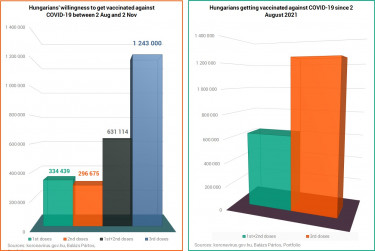
There is no progress in the vaccination campaign. People that have been fully vaccinated in the basic protocol seek third doses, but even that growth rate needs to be higher, while those that have refused to get their shots are not changing their minds en masse despite the worsening epidemiological situation.
And then there's the issue of the waning effectiveness of vaccines, about which you can read more by clicking on the link below.


Cover photo: Getty Images