A closer look at Hungary's improving Covid statistics as vaccination campaign stalls

Vaccination campaign stalls
Hungary’s vaccination programme has also hit a wall, and the government is now launching another HUF 16 billion campaign to promote vaccines. The whole idea of lifting lockdown measures was and still is relying on vaccination 'milestones', and while Hungary does excel in vaccination coverage even in global terms, some of these 'milestones' are almost 100% to be missed. (Not to mention the recurring criticism that other and more important metrics should have been considered when deciding on re-opening steps.)
We will administer one million doses in seven to ten days after the beginning of May, reaching 5 million, then we will hit 6 million by mid-May and 7 million by the third week of May
, Prime Minister Viktor Orbán said on public radio on 9 April. He got a bit carried away, we can say in retrospect.
We’re not even at 5.2 million with first doses, and there are still more than three million unvaccinated adults in Hungary, and most of them have no intention to get jabbed. This is a problem because even with the 800,000 official infections - or let's be generous/pessimistic and say up to two million Hungarians were infected so far - Hungary remains far from the 80% to 90% herd immunity threshold required by the UK variant, and with Indian variant already in Hungary. Some say the multiplier could actually be 6 or 7 rather than 3 or 4 (see more about this below), in which case it’s a whole different story.
The following chart includes the percentage of Hungary's population that received their first and second doses, as well as a 14-day average of these figures. Why 14 days? Because you'll have some degree of protection within 14 to 21 days after the first jab, and full protection 10 to 14 days after the second one. Hence, the lines give you a better idea of the actual 'immunity' of those that have been inoculated. More accurate figures can be achieved by taking into consideration the efficacy of the different vaccines administered, though.
(Here's a rough estimate, though. Pfizer: 95-96%; Moderna: 94-95%; Sputnik V: 93-94%; Astra Zeneca's Novavax: 88-90%; Sinopharm: err, who knows; 75-80% (?); Janssen: 75-85%. Their weighted average could be around 90%.)

And here's a twin chart. The one on the left depicts the same as the one above but only for May. The areas show the 14-day averages and the lines the normal percentage of the population vaccinated with the 1st and 2nd doses.
The right-hand chart is a snapshot of the vaccination coverage as of 1 June, i.e. the share of the population that can be considered [partly or fully] protected after their respective first and second jabs.

Vaccinating children and adolescents
And this is where the vaccination of children and adolescents come into play.
Today, the European Centre for Disease Prevention and Control (ECDC) adopted a technical report on COVID-19 vaccination of adolescents. The report presents a set of key elements to take into account when considering the vaccination of adolescents against COVID-19.
According to the report, the vaccination of adolescents at high risk of severe COIVD-19 should be considered a priority, as with other age groups.
This report follows the positive opinion of the European Medicines Agency (EMA) on the use of the BioNTech / Pfizer vaccines for 12-15 year olds, and the Commission's adoption of an amended conditional market authorisation, reflecting EMA's positive opinion.
Hungary has so far approved the use of Comirnaty (by Pfizer/BioNTech) for adolescents aged 16-18.
The country has over 1.4 million childred aged 0-14, and some experts argue that sooner or later they - particularly those with conditions that increase the risk of severe COVID-19 - would also need to be vaccinated not only to make them immune to SARS-CoV-2 but also to prevent new variants from developing among them and also to help the country reach the heard immunity threshold (currently estimated at 80 to 90%).
On 20 May, the European Commission confirmed a new deal with Pfizer/BioNTech for the possible purchase of up to 1.8 billion doses until 2023, following 600 million doses ordered via the two previous contracts.
Hungary was the only country in the bloc that opted out of the joint purchase. Prime Miniter Viktor Orbán's chief of staff Gergely Gulyás said that even if a booster shot was needed "there are plenty of vaccines from Eastern and Western sources as well," he said. Orbán has strong ties with Russia and China and Hungary had green-lighted the use of their shots before clearance by the EMA or the World Health Organisation (WHO).
Even if Hungary currently believes it has enough doses of Comirnaty, the vaccine remains effective for six months even if it stored (prior to dilution) at -90 °C to -60 °C in the original package, protected from light.
Moderna said its COVID-19 vaccine is considered safe and highly effective in children ages 12 to 17. China's Sinopharm said in early March that it had completed clinical trials for groups aged 3-17 and would submit its data for approval soon. No details of the trial were disclosed and unless Hungary choses to go ahead without EMA approval again, using BBIBP-CorV for children may not be an option for a while.
As regards Russia's Sputnik V, it has not been cleared for use for children yet, but the director of its developer Gamaleya Research Center said in February that the formulation of the vaccine for children would not change, although dosages of the preparation would differ depending on age. He also said research this time would be conducted in terms of a nasal form of this vaccine, which, quite possibly, will also be first of all recommended to children.
In hospital, on ventilator, active cases
The spotlight is also on the number of active cases, people with coronavirus infection in hospitals and on ventilators, in all kinds of aspects and ratios, using various averages.
The first two charts show daily readings and 3-day averages of these. There’s a red flag on the left-hand chart, not literally, though. The warning sign is that the curve showing the number of COVID-19 patients in hospital and requiring mechanical ventilation has started to flatten over the last three to four days, i.e. the rate of the decline is switching to stagnation.
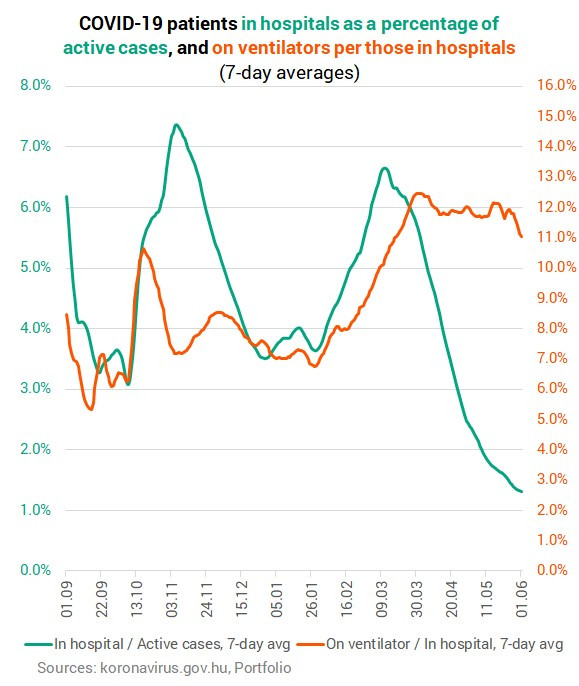
The right-hand chart shows the ratio of those in hospital to active cases and those on ventilator to those in hospital. The general observation is that the former figure has been dropping all month, but there seems to be stagnation at the end of May, and the other ratio has been hovering between 11 and 13% throughout last month (although it dropped to 10.6% yesterday, but the 3-day average remains over 11%).

Here’s are the same figures, only with 7-day averages.
Keeping track of the changes
The calculations in the following charts are based on 7-day averages.
The first chart shows ratios of 7-day averages: [the 7-day average of a given day – 7-day average of the previous day] / 7-day average of the previous day.
What we see is that the number of active cases has been dropping more than the number of those in hospital, i.e. when we see increases in the number of recoveries from coronavirus, it’s mostly because GPs are reporting them. (The shifts in the number of COVID-19 patients in hospital and on ventilator have been largely in tandem.)

The following chart, well, that’s a bit more complicated.
Put simply, these are the ratios of the changes (curves) you see above. The blue line: orange/green, i.e. change in the number of hospitalised COVID-19 patients per change in active cases (with 7-day averages). Red line: blue/orange (on ventilator, 7-day average) / in hospital (7-day average). Wherever the ratios are over 100% (everywhere), the numerator is larger than the denominator, i.e. the rate at which they discharge Covid patients from hospitals (including those that are reported recovered by GPs) is higher than the rate at which the number of active cases is dropping. This means that an ever smaller percentage of active cases are in hospital.

Changes in test positivity
And the charts tackling the positivity rate. There are a bunch of them, with 3-day, 5-day, 7-day, 10-day, 14-day and 21-day averages.
First here are those that put the spotlight on changes over the last two weeks, and then four more that encompass May as a whole.
There was a marked decline in the positivity rate up until 25 May but the momentum seems to have broken there and the curve is starting to flatten.
Stagnation on these charts might or might not be the first sign of a turnaround. We’ll need to wait at least one more week to see if this is the fourth wave or not.

On the Facebook page of Balázs Pártos, who is also behind some of these charts and most of the analytic remarks, someone pointed out that about 37% of Hungary’s adult population have already received their second jab, and that the actual number of those that recovered from the infection could be 6 to 7 times as high as the official figure rather than "only" 3 to 4 times higher.
If he’s right, there will be no fourth wave at all
, commented Pártos.
“It’s all good so far, and if he’s right, we’ll know why the third wave lost steam in mid-April.
But it remains a mystery why the second wave stopped in mid-December [2020]. There were a lot fewer infections and no one was vaccinated then.
Scroll down quite a bit - while checking out the following charts, of course - to read more about how Hungary's vaccination campaign is doing.


And let's see these columns and curves for the whole of May.


Cover photo: Getty Images