COVID-19: Key stats worsen despite official meddling with ventilation data in Hungary


As of Monday, without any warning, remark or explanation, the Coronavirus Task Force started to publish only the number of Covid patients in invasive ventilation. The number of patients supported by noninvasive ventilation (NIV) is not published.
In effect, the Coronavirus Task Force has rendered a key metric of the pandemic quasi useless.
Here’s how it works in practice:
The number of Covid patients hospitalised went up to 7,438 from 6,913 (+8%) between Thursday and Sunday, while the number of patients ventilated dropped to 538 from 695 (-23%). By Monday evening, there were 7,596 people with coronavirus infection in hospital (+158 or +2%), while the number of ventilated patients dropped to 513 (-25 or -5%). The respective changes from Monday to Tuesday were -50 (-1%) and +49 (+10%). It’s bonkers.
Since we would like to maintain the comparability of the number of ventilated Covid patients as intact as possible, based on the previous ratios between the number of patients in hospital and on ventilator we multiply the official figure with 1.4 (+40%) for our statistics. It’s not extremely scientific, but it’s better than not being able to make comparisons at all.

The daily test positivity rate jumped to over 36% from 31% a day earlier with 50% more tests performed (30,000). The 3-day percent positive also rose to over 32% from 25.5%. As you can see on the charts below, the 3-day / 21-day test positivity rate dipped to under 100% six times, every time on these three 'weekend' days of the last two weeks. It is now up at 134% again. If we want to be certain that the key epidemiological figures are starting to improve, the 7-day average of the 3-d/21-d positivity rate would need to go south of the 100% mark. It is currently up at 108.5% after hovering around 107 to 108% for about a week, but it is well under 160% recorded in late October.
The abatement of the current 'wave' will first be indicated by the percent positive peaking and retreating. It will be followed by a drop in daily new COVID-19 cases, hospitalisations, the number of ventilated patients, and eventually coronavirus-related deaths.
Changes in the positivity rate are reflected in the other epidemiological data with a delay:
- new cases – 3 to 5 days
- hospitalisations – 7 to 10 days
- patients on ventilator – 12 to 15 days
- deaths – 18 to 22 days.


Estimating Covid fatalities
Based on the number of daily new confirmed COVID-19 cases we have presented a simple model by which we can estimate how many daily Covid deaths we could have in 20 days. The updated projections are in the table below. We have applied the model to daily figures, as well as to 3-day and 7-day averages. All three show that we should expect the number of daily fatalities to keep on rising.
It is a generally accepted and proven fact worldwide that the number of COVID-19 fatalities tracks changes in the number of daily new confirmed cases with a cc. 20-day delay. The model is exceedingly simple: we divide the number of new cases reported today (for the previous day) with the number of daily cases reported 20 days earlier, and multiply this figure with the number of deaths reported today. That should be roughly the number of deaths authorities will report 20 days from now.

Using the multipliers we get by comparing the current death figures with those 20 days ago we find that the above forecasts are conservative. Multiplying the latest number of fatalities with the increase between 10 Nov and 30 Nov we would have 9.5%, 18.6% and 22% higher estimates for 20 Dec for the daily, 3-day average and 7-day average figures, respectively.
Note that these are all mortality data expected to be reported by the Coronavirus Task Force. The mortality stats of the Central Statistical Office (KSH) to be published (several months) later will show a lot more deaths. Needless to say, there is no way to forecast the number of Covid deaths with pinpoint accuracy, but these forecasts should at least give us an idea of what is to come.

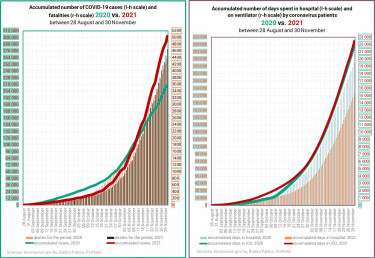
The tables below show how the changes in the number of daily new confirmed COVID-19 cases, hospitalisations and the number of ventilated Covid patients in 2021 and 2020. From the comparison of daily figures we have switched to lining up 7-day averages. This is to avoid distortions caused by comparing weekdays with weekend days when authorities do not publish statistics, and the aggregate data released on Mondays have to be distributed for three days with a certain methodology.
In the top chart we compared the figures of 30 November to one, two, three, and four weeks earlier. The second chart shows the week-on-week changes. The red cells make it evident that the epidemiological situation has been worsening at a more alarming rate in almost every aspect than in the base period. Whereas the number of daily new cases shows a 12% week-on-week decline, the 7-day average is still up 1.4%. Note that the ventilation data are adjusted by Portfolio's methodology, i.e. the official daily figures have been adjusted 40% higher since 28 Nov, not just for the sake of comparability but also to reflect reality more accurately.


Aggregate data
The number of Covid deaths per days spent in hospital by Covid patients is higher this year than in the same period of 2020. The number of those in intensive care units is also higher. Only a smaller fraction of registered cases is (can?) be taken to hospital but once they are there, a higher percentage of them dies than last year. The bottom right chart shows a higher ratio of deaths in ICUs, as well. (The average is lower, hence they last longer in ICUs / ventilators, but there are no miracles.)

Number of confirmed cases, patients hospitalised, ventilated, and deaths
All figures are higher now than a year ago, except that fewer infected people are hospitalised. More Covid patients have died, there are more in ICUs, there are more registered and active cases. Only hospitals treat fewer patients…

Aggregate data vs. daily figures --- Hospitalisations, ICUs, fatalities
About 3.5% of newly confirmed COVID-19 cases die in hospital within 12 days. More than 23% of those admitted in ICUs die within 5 days. The current ratios are worse than a year ago, and they bode ill for the accumulation of such cases and consequently for the near future.
Aggregate data vs. daily figures --- Admitted in ICU, longer-term chances of survival
About 13% of those that need hospitalisation will need intensive care. And they do not get out of there in large numbers. The daily figure exceeds the base period’s print. See the above remark. On the right-hand graph you see that over a 20-day period about 3.6% of the registered cases die. (Although there has been a decline in this data, but the daily figures are higher than the aggregate and also higher in annual terms.)

2.9 to 3.4% of registered cases die in hospital within 12 days, and another 1% of them succumb to the disease within the next eight days. Around 4.0% of those taken to hospital today will not be among the living two weeks from now. And there are those that never make it to the hospital; are officially not Covid patients, either because they have never been tested or their positive test results come back too late.

Note that these data refer only to the official statistics provided by koronavirus.gov.hu. The hospitals themselves must have even worse data, and we have no way of knowing who died at home. Only the Central Statistical Office (KSH) data will reveal full mortality data, but only months from now.
Lacklustre progress with vaccinations
If you take a closer look at the current vaccination campaign (announced for Nov 22-28 with a 2.5-week preparation time and then extended by another week) where no prior registration is required to get your first, second or third dose of a COVID-19 vaccine, it will be clear that 3rd doses remain vastly more in demand than 1st or 2nd jabs. It is now evident that it was actually not the “hassle” of prior online registration and appointment booking that prevented around three million Hungarians from getting inoculated against coronavirus. It’s their determination not to get vaccinated. And it’s not even a hassle, but a simple procedure that takes a couple of minutes if you have a social security number, Internet access and a minimal level of digital literacy.
Here's the growth in the weekly vaccinations on the no-reg week compared to the preceding 'normal' week.
- 3rd doses = 403,399 (+37.3%)
- 2nd doses = 24,238 (+45.6%)
- 1st doses = 71,399 (+26%).

Look at the 7-day averages. Enthusiasm fizzling out.

Almost three quarters of ALL VACCINES ADMINISTERED since 2 August were 3rd doses. (Third or booster doses were made available on 2 August in Hungary.)


Cover photo: MTI/Attila Balázs