COVID-19: New cases down w/w, hospitalisations, patients on ventilator still up


Given the weekend impact (authorities disclose aggregate data for Friday, Saturday and Sunday on Monday morning), the daily, 3-day and even the 7-day test positivity data should be treated with more than just a pinch of salt.
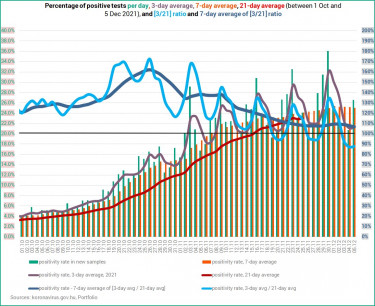
As you can see on the charts below, the 3-day / 21-day test positivity rate dipped to under 100% nine times, always on these three 'weekend' days. This time it came down to 87.7% from 113% on Thursday. We need to wait at least until Wednesday (but prefereably until Thursday and even Friday) to see more meaningful changes. If we want to be certain that the key epidemiological figures are starting to improve, the 7-day average of the 3-d/21-d positivity rate would need to go south of the 100% mark. It is currently at 106.7%, down from 109.3% on Thursday, and well under 160% recorded in late October.


Estimating Covid fatalities
Based on the number of daily new confirmed COVID-19 cases we have presented a simple model by which we can estimate how many daily Covid deaths we could have in 20 days. The updated projections are in the table below. Note that the top section includes estimates based on 3-day averages, rather than on the daily readings (given the distortion caused by the weekend).
It is a generally accepted and proven fact worldwide that the number of COVID-19 fatalities tracks changes in the number of daily new confirmed cases with a cc. 20-day delay. The model is exceedingly simple: we divide the number of new cases reported today (for the previous day) with the number of daily cases reported 20 days earlier, and multiply this figure with the number of deaths reported today. That should be roughly the number of deaths authorities will report 20 days from now.
If
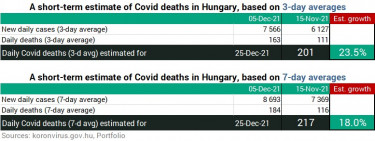
Using the multipliers we get by comparing the current death figures with those 20 days ago we find that the above forecasts are conservative. Multiplying the latest number of fatalities with the increase between 15 Nov and 5 Dec Nov we would have 19%, and nearly 34% higher estimates for 25 Dec for the 3-day average and 7-day average figures, respectively.
Note that these are all mortality data expected to be reported by the Coronavirus Task Force. The mortality stats of the Central Statistical Office (KSH) to be published (several months) later will show a lot more deaths. Needless to say, there is no way to forecast the number of Covid deaths with pinpoint accuracy, but these forecasts should at least give us an idea of what is to come.


The tables below show how the changes in the number of daily new confirmed COVID-19 cases, hospitalisations and the number of ventilated Covid patients in 2021 and 2020. From the comparison of daily figures we have switched to lining up 7-day averages. This is to avoid distortions caused by comparing weekdays with weekend days when authorities do not publish statistics, and the aggregate data released on Mondays have to be distributed for three days with a certain methodology.
In the top chart we compared the figures of 5 December to one, two, three, and four weeks earlier. The second chart shows the week-on-week changes.
The number of new cases does show an improvement, and the 7-da average is already 14.3% lower than a week ago and 6.2% lower than a fortnight ago. The other two key metrics, i.e. the number of Covid patients in hospital and on ventilator still worsened more than a year ago, and show an increase of over 6% and 18.5% w/w, respectively. Note that the ventilation data are adjusted by Portfolio's methodology, i.e. the official daily figures have been adjusted 40% higher since 28 Nov, not just for the sake of comparability but also to reflect reality more accurately.


How is the situation in hospitals?
The number of Covid patients admitted to hospitals and needing mechanical ventilation has been on the rise for a while now, and they are already at late April levels.

On the charts below the 0% line is important. When the curves are under 0% there’s a decline, when they go over 0% it’s an increase. The changes show that the situation in terms of hospitalisations started to worsen after 20 August.
More importantly, when a value is north of 0% but the curve descends, it means an increase at a slowing rate, rather than a decrease. If the curve is above 0% and ascending, it is an increase at an accelerating rate. When we are under 0% and the curve goes lower, it translates into an accelerating decrease, and when it goes up it marks a decelerating decrease.

The number of Covid patients in hospital and of those on ventilator grow almost fully synchronously, apart from a period between mid-September and end-October. In that period there was not enough room for Covid patients and that is why there were many on ventilator relative to the number of Covid patients hospitalised. Then Covid capacities were added to the system and the 'link' was back the way it was before.
The same can be observed at the charts below, only with ratios. The share of those in hospital to the number of active cases has come down from its peak because daily testing picked up, and while there are more and more people with coronavirus infection in hospital, the number of active cases has been growing at a higher rate. And the ventilated / in hospital ratio dropped and steadied due to the aforementioned reason, but it has been rising again over the last few days. Given the changes implemented by the Coronavirus Task Force (see above), this ratio is now only an estimate, the best we can come up with.

Lacklustre progress with vaccinations
The Hungarian government is organising vaccination campaigns in each settlement, and expects the administration of the third doses of COVID-19 vaccines to skyrocket, said Prime Minister Viktor Orbán in his regular interivew with public radio MR1 last Friday.
If you take a closer look at the current vaccination campaign (announced for Nov 22-28 with a 2.5-week preparation time and then extended by another week and then by another one to 12 Dec) where no prior registration is required to get your first, second or third dose of a COVID-19 vaccine, it will be clear that 3rd doses remain vastly more in demand than 1st or 2nd jabs.
It is now evident that it was actually not the “hassle” of prior online registration and appointment booking that prevented around three million Hungarians from getting inoculated against coronavirus. It’s their determination not to get vaccinated or merely a lack of Internet access that prevented them from signing up. And it’s not even a hassle, but a simple procedure that takes a couple of minutes if you have a social security number, Internet access and a minimal level of digital literacy.
Here's the growth in the weekly vaccinations on the first no-reg week compared to the preceding 'normal' week.
- 3rd doses = 643,399 (+168%)
- 2nd doses = 44,579 (+119%)
- 1st doses = 96,391 (+284%).
And here's a comparison of the 2nd no-reg week to the last 'normal' week.
- 3rd doses = 288,101 (+20%)
- 2nd doses = 27,990 (+37.6%)
- 1st doses = 38,967 (+55.5%).
And here's how the 2nd no-reg week compares with the 1st no-reg week.
- 3rd doses = -55.2%
- 2nd doses = -37.2%
- 1st doses = -59.6%


Cover photo: Getty Images