In the wake of revised data – how the Hungarian stats office changed our perception of poverty


How did we end up here?
- The news broke in early April: two researchers discovered absurdities in the KSH's poverty statistics that could not be explained by actual social phenomena. In their article published on Válasz Online, Annamária Tátrai and András Gábos drew attention to the fact that between 2018 and 2022, an unusually large number of people's incomes fell to the poverty threshold.
- The response to the article came almost immediately. In a statement, the KSH rejected the "accusation of deliberate manipulation" and explained the strange phenomenon in part by saying that "the spike observed in the EU-SILC data collection on income distribution is related to the concentration of earnings around the minimum wage. However, the researchers argued convincingly that this explanation was completely incorrect.
- In June, we reached a new chapter: the research group, which had grown to five members, discovered that according to the KSH database, 11-30% of people did not pay taxes, but "received" the tax in each year between 2014 and 2021 — as if they had not paid the taxes to the National Tax and Customs Administration (NAV), but rather the NAV had transferred the money to them, which made it clear that the data was incorrect. These developments suggested systemic problems.
- In September, the office completed its review of the database (known as EU-SILC). According to their statement, the revision was planned in order to incorporate population data from the 2022 census into the statistics. In their statement, they emphasized that "the review confirmed the reliability of the EU-SILC data and methodology," that the main poverty indicator had not changed significantly, and that "the pre-revision data provided an adequate basis for monitoring poverty."

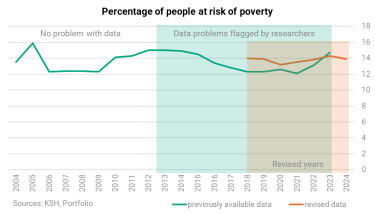
While the composite poverty indicator, the proportion of people at risk of poverty or social exclusion (AROPE) did not show any significant change, the at-risk-of-poverty rate (AROP) —which we have been discussing so far—did. (For more on the content and significance of the individual poverty indicators, see our box below.)
The correction was so significant that it "doubled" child poverty data for 2020,
according to articles written by Anita Élő.
Many question marks
After all this, three questions remained partially or completely unanswered.
- How could the data have been so seriously inaccurate for years?
- Are the current figures reliable at all?
- Exactly what changes have taken place and how do they affect our perception of poverty in Hungary?
The answer to the first question lies with the KSH. Transparency is particularly important because restoring trust in the statistical office is in everyone's interest. The office's figures serve as the basis for important decisions. Just think of poverty data, for example: it is impossible to develop good social policy without knowing the extent of the problem and the areas where intervention is most needed.
For the second question, we can rely on researchers and also on the office.
In order to be able to say with my researcher's integrity that this is indeed the case in Hungary, there is still a lot of work to be done,
said Annamária Tátrai in the Válasz Online podcast. "I trust that this revision, at least for the years it was carried out, has put the data in order, but I don't know that yet."
Based on the KSH announcement, the problems described above regarding "the tower" and "negative tax" were also addressed during the review. However, in order to examine exactly what changes have taken place, the specific data from the sample used to compile the statistics would be required. These are the files in which the figures are broken down to the level of individual persons. Knowledge of this could improve the credibility of the latest data and provide a better understanding of the nature of the changes. Researchers therefore requested the microdata from Eurostat (the KSH does not allow comparison of data before and after the revision). However, to get the full picture, the Office would also need to share with the research community how the data was cleaned and supplemented, because it was during these work processes that the above inconsistencies arose. We know nothing about this, and only the KSH could shed light on the details.
Our article attempts to answer the third question: what has changed as a result of the review, and to what extent, and how does this change our view of poverty in Hungary?
There was not that much improvement after all
The domestic trend in poverty statistics shows that the proportion of poor people increased after the major financial crisis in 2008, but began to decline after peaking in 2012-13.
Recent data suggest (see graph below) that in the second half of the 2010s, there was no reduction in poverty to the extent suggested by earlier statistics.
This at least suggests that the difference between the poverty indicators for the last year for which reliable data is available (2012) and the first year for which data has been revised (2018) is much smaller after the revision.
| How many more people are currently classified as at-risk-of-poverty (AROP) according to our current knowledge? | |
| Year | Change (thousands of people) |
| 2019 | 162 |
| 2020 | 153 |
| 2021 | 57 |
| 2022 | 134 |
| 2023 | 67 |
| 2024 | -38 |
| Source: Calculations by Annamária Tátrai. The author calculated based on a population of 9.539,502. 2024 is the reference year for 2023. | |
Is the revision significant or not?
There are three main indicators of poverty.
- The at-risk-of-poverty (AROP) rate shows what percentage of households live below the poverty line.
- Households with very low work intensity indicates the proportion of households that are effectively unemployed.
- People are considered to be living in severe material and social deprivation if they experience at least 7 of 13 specific problems. The points include not being able to cover unexpected expenses, being in arrears with payments, not being able to heat their homes adequately, or not being able to afford a week-long vacation each year.
These three statistics combine to form a complex indicator, the proportion of people at risk of poverty or social exclusion (AROPE): households that are considered poor according to any one of the above indicators are also considered poor according to the complex indicator.
Fruit tree or apple tree?
Of the three indicators, only the at-risk-of-poverty (AROP) changed significantly as a result of the revision. The KSH may therefore indicate that there were no significant changes. However, AROP is important data in itself, and the Office itself lists it among the "most important indicators of poverty or social exclusion" alongside those listed above. Moreover, researchers have consistently raised issues with the AROP data series in their articles, so the change in the indicator indicates that there were indeed problems with the quality of the data.
"It's as if we had questioned the statistical data on apple yields, which had been corrected in some way (using a method that is largely unknown to us and cannot be verified at this time), but then they would say that, overall, there is no significant change in the fruit yield data after the revision," Annamária Tátrai explained the situation to Portfolio.
The debate on the extent and change in child poverty stems partly from references to various indicators. While, based on 2024 data, 3.6% of children lived in households with very low work intensity, one-tenth (10.5%) lived in severe material deprivation and almost one-fifth (18.1%) in relative income poverty. "They would say that, overall, there is no significant change in fruit production data after the revision," Annamária Tátrai explained the situation to our newspaper.
There are many more poor households with children than we thought
The much-discussed change in the child poverty rate is illustrated in the figure below based on the relative indicator, the pattern of which is very similar to our previous figure.
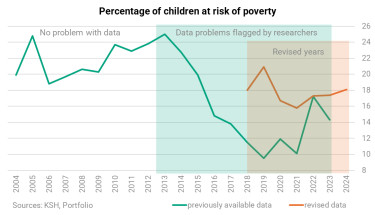
The revision has such a significant impact in this area because the data for households with children has also changed considerably, with the poverty rate increasing by 10-85% (!) in certain years.
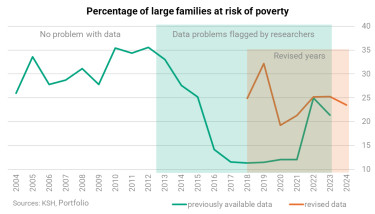
The most striking changes are in the relative poverty rate of large families (with 2 adults and 3 or more children): for 2019, the revision resulted in a 2.8-fold increase.
The revision also reversed the assumption that they would be less affected by income poverty; based on our current knowledge, they are now among the groups that are more affected than average.
This applies to both the overall poverty indicator and its values projected onto individual social groups: the gap between 2017 and 2018 (between the data before and after the revision) is so large that it can hardly be considered a consistent time series. For this reason, the main claim in the KSH's Thursday announcement (also included in the title) that "the trends in poverty indicators have not changed significantly" is not valid.
Due to the structural break caused by the partial revision, data up to and after 2017 are not comparable – this is also acknowledged by the KSH. However, the significant break contradicts the KSH's communication that only methodological fine-tuning took place and that the data prior to the revision continue to provide an adequate basis for monitoring poverty,
Judit Krekó, a member of the five-person research group, told our newspaper in her assessment of the above data series.
Meanwhile, however, it appears that pensioners' relative income situation has improved thanks to the revision.
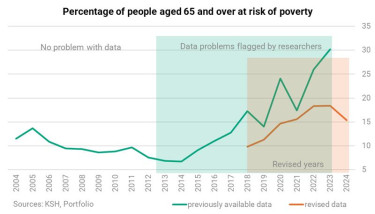
Based on this, it seems as if households with children have swapped places with pensioners in terms of their relative income situation.
Further problems – the poverty gap
The relative poverty indicator linked who is considered poor and who is not to a certain income level, but it does not show the poverty level of those who are poor in greater detail. This is better expressed by the poverty gap indicator.
The poverty gap indicates the extent to which the income of people living below the poverty threshold falls short of the threshold – it is an indicator of the "depth" of poverty. The table above shows how the poverty gap changed in each age group as a result of the revision. Values above 1 indicate an increase, meaning that the gap relative to the poverty threshold has widened, while values below 1 indicate a decrease. It appears that the gap has widened among adults, while the extent of poverty has clearly increased among pensioners living at-risk-of-poverty. (We were unable to find pre-revision data for 2023.)
| How many-fold has the poverty gap increased following the review? | |||||
| 2018 | 2019 | 2020 | 2021 | 2022 | |
| Altogether | 1.13 | 0.82 | 0.97 | 1.58 | 1.04 |
| People aged 0-17 | 0.94 | 0.52 | 0.77 | 2.70 | - |
| People aged 18–64 | 1.19 | 0.91 | 1.06 | 1.63 | 1.17 |
| People aged 65+ | 1.91 | 1.53 | 1.84 | 1.48 | 1.19 |
| Sources: KSH, Portfolio | |||||
Enormous changes in the situation of the Roma
As a result of the revision, the situation of the Roma has perhaps deteriorated the most. In their case, the revision has brought about significant changes not only in relative poverty, but also in all three main poverty indicators. Perhaps the most striking example is 2019: while before the data was reviewed, we were told that roughly one-third (31%) of them lived in severe material or social deprivation, but the current data shows that the majority (57.4%) now do. This reveals an astonishing gap compared to society as a whole, where the same rate was 10.7% in 2019.
| Trends in the three main poverty indicators among the Roma population (%) | |||||||
| 2018 | 2019 | 2020 | 2021 | 2022 | 2023 | 2024 | |
| At-risk-of-poverty (AROP) rate now | 50.4 | 60.2 | 44.3 | 41.4 | 41.4 | 50 | 52.3 |
| Before revision | 38.4 | 34.7 | 36.4 | 33.2 | 42.2 | 41.9 | |
| Severe material & social deprivation now | 57.5 | 57.4 | 57.8 | 46.4 | 51.1 | 47 | 47.5 |
| Before revision | 43.4 | 30.9 | 55.5 | 46.7 | 51 | 46.7 | |
| Proportion of low work intensity now | 15.2 | 16.6 | 24.4 | 18.9 | 21.4 | 19.4 | 18.9 |
| Before revision | 13.7 | 15.2 | 20.2 | 18.7 | 21.6 | ||
| Sources: KSH, Portfolio | |||||||
In 2024, 52.3% of Roma lived below the poverty threshold.
We should be able to see more clearly
The above figures show that our perception of poverty in Hungary has changed significantly as a result of the revision.
- On the one hand, the revision has generally caused major disruptions in the at-risk-of-poverty data series, making it impossible to compare data from before and after 2018 and thus impossible to measure the impact of individual social policy measures.
- On the other hand, since the revision has affected certain social groups in completely different ways, the group of people affected by poverty has also changed completely.
This is problematic also because after 2010, the government announced a new social policy, and data comparability would be essential for analyzing poverty trends since then. The breaks therefore call attention to the fact that the review period should be extended to other 'problematic' years as well.
The revision of poverty data has answered many questions, but it has also left at least as many unanswered – and only the KSH can help to clear up the confusion.
Cover photo (for illustration purposes only): Portfolio