COVID-19: Situation worsens in general, and in hospitals in Hungary


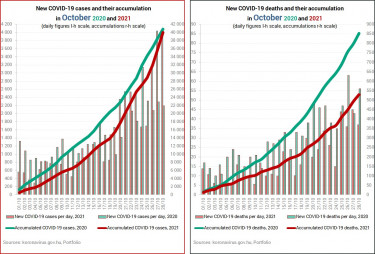
For staters, a few key figures to compare the current 'wave' of the coronavirus pandemic with the one a year ago. And then it's graphs all over the place. At first, there was a 10 to 12-day 'delay' in the current 'wave' compared to the one at the same time of 2020. This gap has narrowed to about 3 days by now.
28 October 2021 vs. 28 October 2020:
- new cases --- 4,041 vs. 2,194 (+84%)
- active cases --- 34,780 vs. 49,024 (-29%)
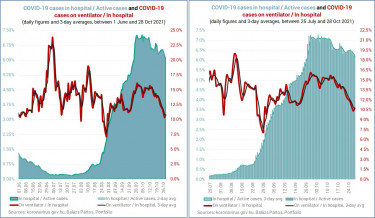
- in hospital --- 2,130 vs. 3,197 (-33.4%)
- on ventilator --- 230 vs. 255 (-5.4%)
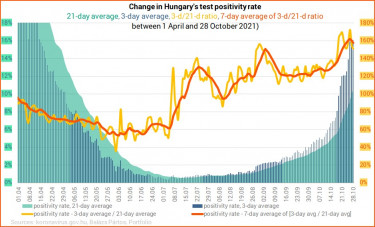
- test positivity --- 17.52% vs. 11.96%
- 3-day average percent positive --- 16.06% vs. 12.82%
- accumulated cases (1 Aug - Oct 28) --- 53,812 vs. 63,601 (-15.4%)
- accumulated deaths (1 Aug - Oct 28) --- 702 vs. 1,036 (-32%)
The government has woken up at last and decided to tighten restrictions to some extent. Mask-wearing will be compulsory in public transport, visiting in health care institutions is banned, and companies are now allowed to require their employees to be vaccinated against coronavirus. State institutions are no exception.
Comparison of daily and monthly accumulated data (new cases, fatalities) for August, September, October, and August-October.


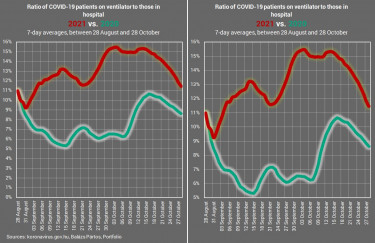
Comparison of 7-day rolling average of new cases, Covid deaths, as well as of coronavirus-related hospitalisations and the number of Covid patients in need of mechanical ventilation.


Balázs Pártos, the original ‘author’ behind some of these graphs commented in a Facebook post about the positivity rate a couple of days ago.
“Interestingly, our best chance in terms of COVID-19 is if the percent positive continues to rise. If it keeps on rising at the [then] current rate, it will reach 30 to 35% relatively soon, and it will practically never breach that level. The test positivity rate was not stuck for a long time there anywhere in the world. The daily peaks are around 35 to 40% everywhere, but the 7-day average is not north of the 35% mark anywhere.
“When we start to approach 30% then we’ll be about a week from the peak in infections, as far as detection goes, that is. In my view, the infection peak is when the positivity rate hits 26-28%. The rate will keep on climbing from there (i.e. from 26 or 28%) for another five, seven or ten days, but those diagnosed then had been tested earlier.
“It’s a rather paradoxical situation, but if test positivity jumps it will be the good news. If it gets stuck around 15%, well, that will suck.”

What the declining ratios on the following charts mean is that hospitals are currently being transformed into Covid centres. The 3-day average ratio of hospitalised Covid patients to the number of active cases is down to 6.2% from over 7% it was for two weeks (29 Sept - 12 Oct). The 3-day average On ventilator / In hospital ratio has retreated to 10.7% from over 15% in early Oct.
On chart below the 0% line is important. When the curves are under 0% there’s a decline, when they go over 0% it’s an increase. The changes show that the situation in terms of hospitalisations started to worsen after 20 August.
More importantly, when a value is north of 0% but the curve descends, it means an increase at a slowing rate, rather than a decrease. If the curve is above 0% and ascending, it is an increase at an accelerating rate. When we are under 0% and the curve goes lower, it translates into an accelerating decrease, and when it goes up it marks a decelerating decrease.

When the Case Fatality Rate (CFR, shown on a reversed scale below) drops the pandemic starts to gather momentum, because CFR = deaths / registered cases. There is an increasing number of new confirmed COVID-19 cases but the number of Covid fatalities is just starting to catch up. Whatever looks like a drop on the chart, is actually an increase in reality.

As regards the left-hand chart below, the number of new COVID-19 cases accumulated since 28 August is only 18% lower than in the same period of 2020, while it was 47% lower only four weeks ago. In the meantime, the accumulated time Covid patients spend in hospital is 33% lower than a year ago, while it was 12% lower four weeks ago and 26% higher eight weeks ago. (The turnaround came about on 22 September, about a month after the no-restrictions four-day celebrations of the foundation of the state on 20 August.)
On the right-hand chart see that only six weeks ago (mid-Sept) the number of accumulated days spent in ICUs (practically on ventilator) was 120% higher than in the base period, while the difference has narrowed to merely 3% by now despite the lower number of cases (accumulated) and fewer days (accumulated) coronavirus patients spend in hospital. This means that there should be a lot more cases to match the severity of this wave as demonstrated by the number of days spent on ventilator.
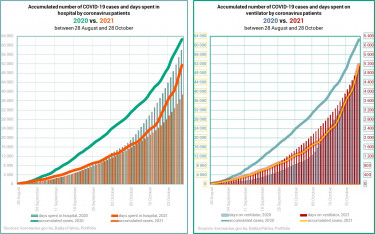
In terms of the accumulated number of Covid-related fatalities we are not we were a year ago, but there were no vaccines then and cross-immunity (if it works at all) could not have been as strong as currently. The right-hand chart also depicts that those that admitted to hospital with coronavirus infection are generally in worse condition than Covid patients a year ago.


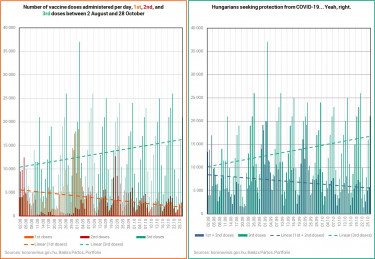
There is no progress in the vaccination campaign. People that have been fully vaccinated in the basic protocol seek third doses, but even that growth rate needs to be higher, while those that have refused to get their shots are not changing their minds en masse despite the worsening epidemiological situation.
And then there's the issue of the waning effectiveness of vaccines, about which you can read more by clicking on the link below.


Cover photo: Getty Images