COVID-19: Positivity rates jump in Hungary


Local authorities have performed slightly more than 9,200 COVID-19 tests on Monday, a drop we already got used to, hence it's no wonder the daily positivity rate leaped to 36.63%. Due to such erratic testing practices, the daily and short-term percent positive data give us very little guidance as to where the pandemic is headed. The three-day positivity rate has also jumped to 24% from 19.9%.
After dropping south of the 100% mark over the weekend, the 3-day / 21-day percent positive bounced back to 117.7%, but we need to see data on Wednesday and Thursday to see more clearly. Given the extremely rapid spread of the Omicron variant, we should not expect positivity rates to subside. The 7-day average of the 3-d/21-d ratio is over 117%.


The 7-day rolling average of new COVID-19 keeps on rising, and the number of Covid deaths will follow suit.

How is the situation in hospitals?
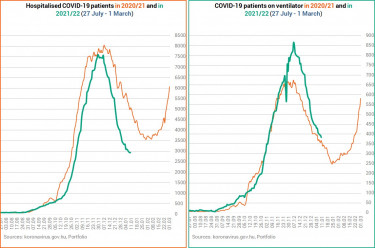

On the charts below the 0% line is important. When the curves are under 0% there’s a decline, when they go over 0% it’s an increase. The changes show that the situation in terms of hospitalisations started to worsen after 20 August.
More importantly, when a value is north of 0% but the curve descends, it means an increase at a slowing rate, rather than a decrease. If the curve is above 0% and ascending, it is an increase at an accelerating rate. When we are under 0% and the curve goes lower, it translates into an accelerating decrease, and when it goes up it marks a decelerating decrease. As you can see, we are witnessing the latter here, and there was a turnaround in the improvement around 27-29 December.

What do the changes mean?
The chart below shows the number of hospitalised Covid patients as a percentage of active cases and the On ventilator / In hospital ratio.
When a pandemic 'wave' starts, the percentage of hospitalised patients relative to active cases always soars, because there is still a relatively low number of official cases due to inferior testing practices, and because early on most people with positive tests are likely in hospital.
The green curve peaks around 7% in every 'wave' and then the ratio starts to drop as authorities 'find' more and more infections. The reason why this curve starts to descend even though the number of hospitalisations goes up drastically is because the increase in new confirmed COVID-19 cases is even more staggering.
When there's a relative calm, the red curve picks up sharply, because only those Covid patients are left in hospital that are in severe condition. The others either recovered and were discharged or died.
Early in these waves this ratio always rises rapidly (low number of tests, many in severe condition in hospital, a lot of them in ICUs), but then the ratio starts to improve.
There was an anomaly here, namely that this trend was broken in late November 2021. The proportion of those in hospital to active cases starts to drop, but the proportion of Covid patients in intensive care (relative to those in hospital) goes up. This indicates that there are too few people in hospital compared to before, i.e. there are more serious cases. As it is not the course of the disease that has become more severe, this indicates insufficient hospitalisation. As the number of active cases is on the rise, while the number of Covid patients in hospital is still dropping, the In hospital / Active cases ratio keeps on falling, while the other ratio (On ventilator / In hospital) remains largely unchanged; it has been hovering around 13.3-13.4% for more than two weeks now.

While about one third of the population (3.18 mn people) are inoculated with three doses of COVID-19 vaccines, about 3.5 million people have not received a single shot yet. Also, as the effectiveness of vaccines wanes over time, about three million Hungarians have diminished or no protection against coronavirus infection, even after two jabs.
The cabinet has announced a new vaccination campaign for January where Hungarians may, after on-site registration, ask for their first, second or third dose of a COVID-19 vaccine. The shots will be administered at vaccination locations between 2 and 6 p.m. on Thursdays and Fridays and between 10 a.m. and 6 p.m. on Saturdays.
We have written about the importance of jabs, particularly third doses, at the link below.


Cover photo: Getty Images