COVID-19: New cases jump 80% week on week to new record high in Hungary

The Omicron variant (B.1.1.529) is spreading so rapidly that it is starting to make no sense to compare current figures with those from a year ago. We are in an immensely worse position than in January 2021 in terms of the number of new cases, active cases and positivity rates. In respect of hospitalisations, the number of Covid patients ventilated and fatalities the figures are still better, but this is mainly because there's a lag between the occurrence of new cases and everything else. Omicron might prove to be causing less severe disease than Delta on average, but this definitely does not mean that those unvaccinated can relax. Not by a long shot.
Here's the gist of today's data release:
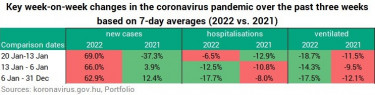
- new cases up 2.7% d/d, 79% w/w;
- 7-day average of new cases up 9.5% d/d, 69% w/w;
- Covid patients in hospital +1 d/d, +63 (+2.4%) w/w;
- Covid patients on ventilator -0.5% d/d, -17% w/w;
- Covid deaths -9.2% d/d, -11% w/w;
- Positivity rates going up.

As the erratic testing practices have rendered the daily and even the short-term average positivity rates practically useless, we need to use longer-term averages to see where the pandemic is headed.

The 7-d / 28-day average and its 7-day average, for two periods: starting from 1 October 2021 and starting from 1 September 2020. Both are at their mid-Nov 2021 levels but have dropped slightly.

The 7-day average has hit a new all-time high!

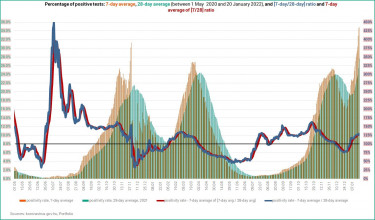
The 7-day rolling average of new COVID-19 keeps on rising, and the number of Covid deaths is likely to follow suit, unless the Omicron variant causes less severe disease than Delta. While this may be true on average, experts of the World Health Organisation (WHO) warned against taking Omicron lightly.


Here are a couple of charts depicting the sitation in hospitals.
On the two charts below the 0% line is important. When the curves are under 0% there’s a decline, when they go over 0% it’s an increase.
More importantly, when a value is north of 0% but the curve descends, it means an increase at a slowing rate, rather than a decrease. If the curve is above 0% and ascending, it is an increase at an accelerating rate. When we are under 0% and the curve goes lower, it translates into an accelerating decrease, and when it goes up it marks a decelerating decrease. As you can see, we are witnessing the latter here, and there was a turnaround in the improvement around 27-29 December. The number of active cases started to go up at an increasing rate at that time and the pace has only picked up. The changes in terms of hospitalisations and mechanical ventilation have been showing a similar start but then a different and mixed pattern. We need data for a couple of more days to see if the trend is changing for the worse or not, but an improvement would be surprising. The ascent of orange curve has already been tracked by the blue one.

Should you be interested how the situation changed a year ago, the left-hand chart shows exactly that. It spans between 1 Nov 2020 and 28 Feb 2021, and the current period is indicated by the red ellipse.

Whereas there are fewer Covid patients in hospital than a year ago, there are nearly just as many of them on ventilator.

The number of coronavirus patients as a percentage of those hospitalised has been dropping.

The chart below shows the number of hospitalised Covid patients as a percentage of active cases and the On ventilator / In hospital ratio.
When a pandemic 'wave' starts, the percentage of hospitalised patients relative to active cases always soars, because there is still a relatively low number of official cases due to inferior testing practices, and because early on most people with positive tests are likely in hospital.
The green curve peaks around 7% in every 'wave' and then the ratio starts to drop as authorities 'find' more and more infections. The reason why this curve starts to descend even though the number of hospitalisations goes up drastically is because the increase in new confirmed COVID-19 cases is even more staggering.
When there's a relative calm, the red curve picks up sharply, because only those Covid patients are left in hospital that are in severe condition. The others either recovered and were discharged or died.
Early in these waves this ratio always rises rapidly (low number of tests, many in severe condition in hospital, a lot of them in ICUs), but then the ratio starts to improve.
There was an anomaly here, namely that this trend was broken in late November 2021. The proportion of those in hospital to active cases starts to drop, but the proportion of Covid patients in intensive care (relative to those in hospital) goes up. This indicates that there are too few people in hospital compared to before, i.e. there are more serious cases. As it is not the course of the disease that has become more severe, this indicates insufficient hospitalisation. As the number of active cases is on the rise, while the number of Covid patients in hospital is still dropping, the In hospital / Active cases ratio keeps on falling, and so does the On ventilator / In hospital. The latter is now as low as 10.7%, down from 13.7% on 5 January.

Vaccinations picked up, with more than 28,000 doses administered yesterday, a welcome growth from a dreadfully low figure of less than 13,000 a day earlier.
The vaccination tally for yesterday is as follows:
- 4,042 first doses (14.4% of total)
- 3,821 second doses (13.6% of total)
- 20,162 third doses (72% of total)
The 7-day averages are:
- 3,552 first doses
- 3,297 second doses
- 19,405 third doses.


Cover photo: MTI/János Vajda