COVID-19: Nearly 40,000 new cases in Hungary over the weekend


The Omicron variant (B.1.1.529) is spreading so rapidly that it is starting to make no sense to compare current figures, particularly the number of new cases, with those from a year ago. While there are a lot fewer people with coronavirus infection in hospital than in early 2021, there are almost as many on ventilator. Omicron might prove to be causing less severe disease than Delta on average, but this definitely does not mean that those unvaccinated can relax. Not by a long shot.
Here's the gist of today's data release:
- new cases for Friday, Saturday and Sunday up 88% w/w;
- 7-day average of new cases up 20% d/d, 84% w/w;
- Covid patients in hospital +291 (+11%) w/w;
- Covid patients on ventilator -23% w/w;
- Covid deaths (3 days) -55% w/w;
- Positivity rates still going up.

As the erratic testing practices have rendered the daily and even the short-term average positivity rates practically useless, we need to use longer-term averages to see where the pandemic is headed.

The key indicators on the graph below are the 7-d / 28-day average and its 7-day average, for two periods: starting from 1 October 2021 and starting from 1 September 2020. Both are at their mid-Nov 2021 levels but have dropped very slightly.
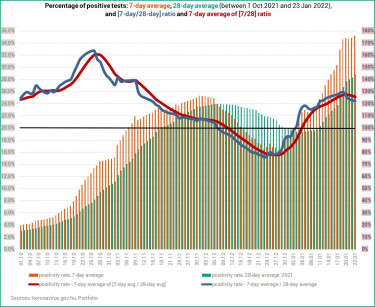
The 7-day average has risen to yet a new all-time high!


The 7-day moving average of new daily COVID-19 cases is going up relentlessly, while the 7-day average of Covid deaths has oddly turned around after rising for about five days.

The chart below shows the data depicted on the two charts above, so it's a kind of 4 in 1 chart. When comparing the number of Covid cases and coronavirus-related deaths, one might say: so far, so good. In other words, there are way more cases than a year ago, yet these apparently claim fewer lives.

The situation in hospitals, however, warrant caution and should prevent our optimism from running wild.
On the two charts below the 0% line is important. When the curves are under 0% there’s a decline, when they go over 0% it’s an increase.
More importantly, when a value is north of 0% but the curve descends, it means an increase at a slowing rate, rather than a decrease. If the curve is above 0% and ascending, it is an increase at an accelerating rate. When we are under 0% and the curve goes lower, it translates into an accelerating decrease, and when it goes up it marks a decelerating decrease. As you can see, we are witnessing the latter here, and there was a turnaround in the improvement around 27-29 December (black oval). The number of active cases started to go up at an increasing rate at that time and the pace has only picked up. The changes in terms of hospitalisations and mechanical ventilation have been showing a similar start but then a different and mixed pattern occurred. The ascent of orange curve was first tracked by the blue one but then the change in the number of ventilated patients started to improve.
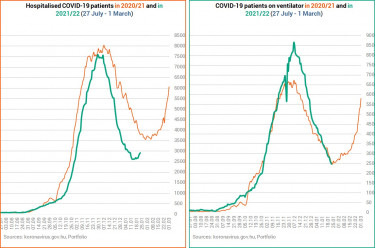
The left-hand chart shows what happened a year ago. The time series spans between 1 Nov 2020 and 28 Feb 2021, and the same dates in 2021 and 2022 are indicated by the red ovals. The black oval, as noted above, shows when the turnaround this year occurred.

Whereas there are fewer Covid patients in hospital than a year ago, there are nearly just as many of them on ventilator.

The chart below shows the number of hospitalised Covid patients as a percentage of active cases and the On ventilator / In hospital ratio.
When a pandemic 'wave' starts, the percentage of hospitalised patients relative to active cases always soars, because there is still a relatively low number of official cases due to inferior testing practices, and because early on most people with positive tests are likely in hospital.
The green curve peaks around 7% in every 'wave' and then the ratio starts to drop as authorities 'find' more and more infections. The reason why this curve starts to descend even though the number of hospitalisations goes up drastically is because the increase in new confirmed COVID-19 cases is even more staggering.
When there's a relative calm, the red curve picks up sharply, because only those Covid patients are left in hospital that are in severe condition. The others either recovered and were discharged or died.
Early in these waves this ratio always rises rapidly (low number of tests, many in severe condition in hospital, a lot of them in ICUs), but then the ratio starts to improve.
There was an anomaly here, namely that this trend was broken in late November 2021. The proportion of those in hospital to active cases starts to drop, but the proportion of Covid patients in intensive care (relative to those in hospital) goes up. This indicates that there are too few people in hospital compared to before, i.e. there are more serious cases. As it is not the course of the disease that has become more severe, this indicates insufficient hospitalisation. As the number of active cases is on the rise, while the number of Covid patients in hospital is still dropping, the In hospital / Active cases ratio keeps on falling, and so does the On ventilator / In hospital. The latter is now as low as 8.9%, down from 13.7% on 5 January.

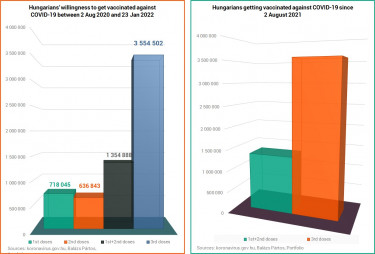
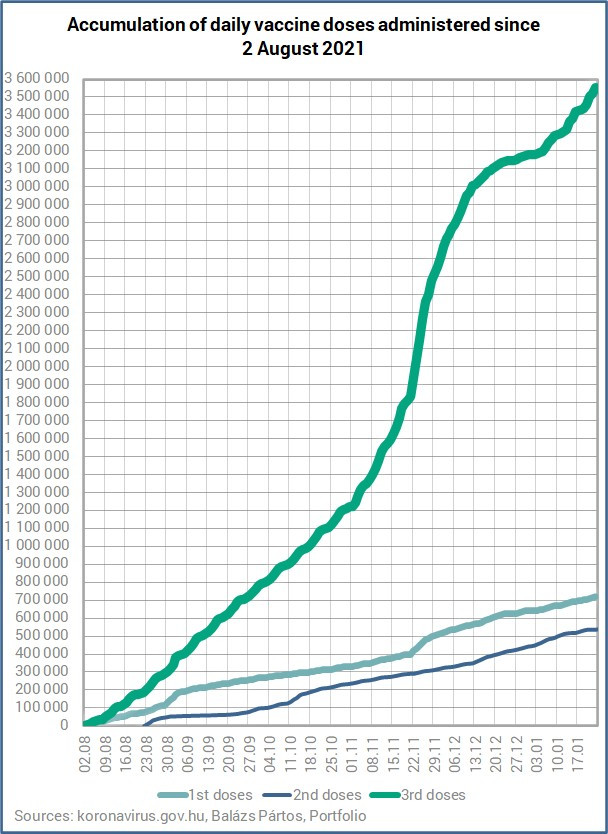
There are still about 3.4 million Hungarians that have not received a single dose of any COVID-19 vaccine, while more than 36% of the population (3.55 mn) have been vaccinated with three doses. Read more about the 'success' of the weekend vaccination campaigns in a separate article here.

Cover photo: Getty Images