COVID-19: Nearly 8,000 new cases in Hungary, up 50% week on week


As you can see in the table above, each positivity rate is higher than a year ago. The daily figures (up at 43% from 36.6%), however, give us no guidance as to what could be waiting for us. Testing practices in Hungary are... erratic to say the least. Even the 3-day average percent positive has become unreliable for forecasting. The weekend impact is immense, as the graph below attests. There are no reports on weekends therefore the figures published on Monday refer to Friday, Saturday and Sunday.
Authorities stopped publishing Covid stats on weekends in mid-June 2020. Based on reports up to that point Portfolio distributes the difference between the Friday morning and Monday morning reports as follows: Saturday = Friday+[Monday-Friday]x0.42, Sunday = Saturday +[Monday-Friday]x0.38. Even with this method the number of tests reported on Tuesdays tends to be cc. 50% lower than the one 'reported' on Monday.

As mentioned above the 3-day / 21-day positivity rate might not be such a great indicator anymore therefore it may be worth switching to a longer term, i.e. the 7-day / 28-day ratio.
Here's what some short-term positivity rates and the 3-d/21-d ratios show.
And here's our 'new' indicator, the 7-d / 28-day average and its 7-day average, both on the shorter and longer terms.


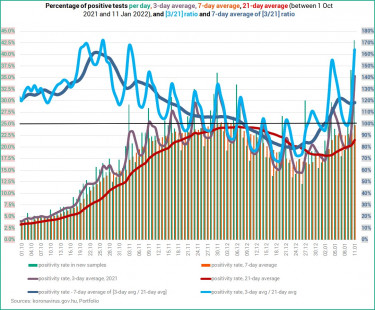
Here's how two longer-term percent positive averages in 2020/21 and 2021/22 compare. We're the red curve and the pink area, and they are not looking good.

The 7-day rolling average of new COVID-19 keeps on rising, and the number of Covid deaths will follow suit.

What about the situation in hospitals?
Here you go. If you fail to adjust the number of ventilated COVID-19 patients by the change implemented by authorities, you will find that the situation is better now than a year ago. It would be a mistake.
As of 28 November, hospitals are required to report how many coronavirus patients they have on invasive and non-invasive ventilation. Since then, however, authorities have been reporting only the former data, which proved to be some 40% lower than before 28 Nov when hospitals were reporting either only invasive or both invasive and non-invasive ventilation figures. The intention of authorities was explicitly to provide clearer more detailed statistics, but they failed miserably and made ventilation stats only murkier.


On the charts below the 0% line is important. When the curves are under 0% there’s a decline, when they go over 0% it’s an increase. The changes show that the situation in terms of hospitalisations started to worsen after 20 August.
More importantly, when a value is north of 0% but the curve descends, it means an increase at a slowing rate, rather than a decrease. If the curve is above 0% and ascending, it is an increase at an accelerating rate. When we are under 0% and the curve goes lower, it translates into an accelerating decrease, and when it goes up it marks a decelerating decrease. As you can see, we are witnessing the latter here, and there was a turnaround in the improvement around 27-29 December.

What do the changes mean?
The chart below shows the number of hospitalised Covid patients as a percentage of active cases and the On ventilator / In hospital ratio.
When a pandemic 'wave' starts, the percentage of hospitalised patients relative to active cases always soars, because there is still a relatively low number of official cases due to inferior testing practices, and because early on most people with positive tests are likely in hospital.
The green curve peaks around 7% in every 'wave' and then the ratio starts to drop as authorities 'find' more and more infections. The reason why this curve starts to descend even though the number of hospitalisations goes up drastically is because the increase in new confirmed COVID-19 cases is even more staggering.
When there's a relative calm, the red curve picks up sharply, because only those Covid patients are left in hospital that are in severe condition. The others either recovered and were discharged or died.
Early in these waves this ratio always rises rapidly (low number of tests, many in severe condition in hospital, a lot of them in ICUs), but then the ratio starts to improve.
There was an anomaly here, namely that this trend was broken in late November 2021. The proportion of those in hospital to active cases starts to drop, but the proportion of Covid patients in intensive care (relative to those in hospital) goes up. This indicates that there are too few people in hospital compared to before, i.e. there are more serious cases. As it is not the course of the disease that has become more severe, this indicates insufficient hospitalisation. As the number of active cases is on the rise, while the number of Covid patients in hospital is still dropping, the In hospital / Active cases ratio keeps on falling, while the other ratio (On ventilator / In hospital) remains largely unchanged; it has been hovering around 13.3-13.4% for more than two weeks now.

While about one third of the population (3.3 mn people) are inoculated with three doses of COVID-19 vaccines, about 3.5 million people have not received a single shot yet. Also, as the effectiveness of vaccines wanes over time, about three million Hungarians have diminished or no protection against coronavirus infection, even after two jabs.
The cabinet has announced a new vaccination campaign for January where Hungarians may, after on-site registration, ask for their first, second or third dose of a COVID-19 vaccine. The shots will be administered at vaccination locations between 2 and 6 p.m. on Thursdays and Fridays and between 10 a.m. and 6 p.m. on Saturdays.
We have written about the importance of jabs, particularly third doses, at the link below.